Last updated: Sat, 6 Jun 2009 09:15:36
It is now Sun, 19 Sep 2010 02:59:17
Last updated: Sat, 6 Jun 2009 09:15:36
It is now Sun, 19 Sep 2010 02:59:17

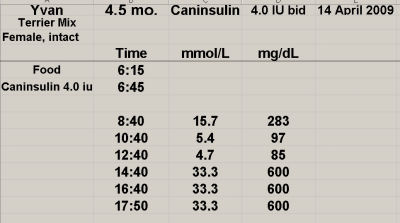
[cwcd-yvanbgs05.jpg] Yvan BGs - 14 April 2009
To make it easier to follow progress in a dog featured here, I am adding a kind of tracking list, which merely links to other charts for the same dog.
A chart is useful visual assistance.

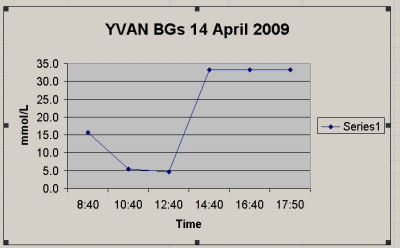
[cwcd-yvanbgs01.jpg] Yvan BGs - 14 April 2009
The chart above has the limitation that the readings shown as 33.3 mmol/L (which is the same as approximately 600 mg/dL) were, on the meter used, shown simply as "HI", which, in effect, means, "Off the chart!"
All the same, I wanted to represent those readings on the chart, so I made them the highest reading that the meter might have registered.
I hope to gain more skills with Microsoft Excel and its charting capabilities; meantime, this chart should serve, as it gives a reasonable idea of Yvan's curve taken on 14 April, 2009.
"mmol/L" means, "millimoles per Liter," which is the standard unit of BG measurement outside the United States. However, in the list of readings, I have shown the figures in mg/dL, which means "milligrams per deciLiter," as well. That is the standard for BG measurements in the U.S.
One day maybe I'll learn how to get Excel to add the mg/dL numbering as well.


