Last updated: Sat, 6 Jun 2009 08:49:58
It is now Sun, 19 Sep 2010 03:03:52
Last updated: Sat, 6 Jun 2009 08:49:58
It is now Sun, 19 Sep 2010 03:03:52

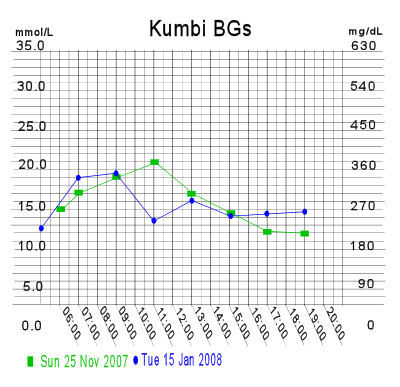
[cw7022-kbgchart1.jpg] A chart showing two of Kumbi's BG curves
Cutting it down to size for one of my web pages affects it a bit adversely, but at least it gives the idea!
I've seen various BG charts that don't really represent a BG curve very well. Usually, that's because the numbers have been put into a charting program such as Microsoft Excel, which, unless you are really skilled with it, will simply do what you tell it to.
With the occasional result that, say, if you took readings two hours apart in the morning, and three in the afternoon, the chart won't allow for the time differences, so the graph won't come out quite right.
Of course if you DO know what you are doing, the program will also do what you tell it to. So you can see where the crucial element lies - that is, in our own knowledge and skills!
I am very bad myself at working with a program like Excel, though I have tried it a few times, and I've tried Open Office's charting program too, which has a bit more flexibility. But I have a hard time with any such program anyway; it's not at all my strong point!
So I ended up drawing my own, which can be hazardous to charting results!
This page, then, is just for fun. I recommend nobody lean on this page. It might make a hole in the page.
Rrrrrrrrrrrrrip!
Although charts are fun, but not necessary, the numbers you get when you do a BG curve would be very helpful for your vet's records on your dog. Therefore, please by all means, share your numbers with your vet!
I used to phone my results in by voice phone, but then my vet got somebody to do email for the office, so now I send my results by email, which helps achieve accuracy in reporting.
I hope to add to this page and others in this series.
To make it easier to follow progress in a dog featured here, I am adding a kind of tracking list, which merely links to other charts for the same dog.


